
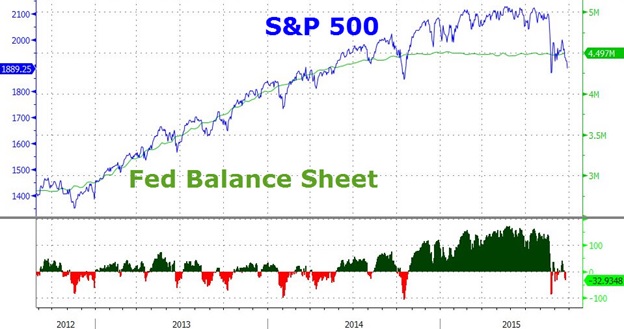
At end of the third quarter, the S&P 500 had its first negative total return quarter since the third quarter of 2012. In addition to having its first negative quarter in three years, S&P 500 returns have now turned negative when measured from the end of QE3 (“quantitative easing” round 3), which concluded in October 2014—giving credence to the argument that in order for equity returns to remain positive the Federal Reserve must perpetually expand its balance sheet (recall that equity returns faltered after QE1, which led to QE2, and after QE2, which led to QE3…)
While the Fed itself continues to communicate its intention to raise rates in 2015, the recent pullback in equities has led to murmurs from some market participants that the Fed should do more quantitative easing. Indeed, Fed funds futures rates indicate that investors are not expecting a rate increase until March 2016 (whereas they had seen two rate increases in 2015 earlier this year). Those economists who see recession on the horizon claim the Fed may have already missed its window to tighten, making this the first economic cycle where the Fed did not tighten even once between recessions.
So where do things stand? On the macroeconomic front there are several interdependent developments to take note of, all driven primarily by what’s happening in China. As China’s growth has slowed and fears of a hard landing have surfaced, estimates for global growth have come down. Commodity prices have commensurately tumbled, leaving many commodity-exporting emerging market countries in dire straits financially, which has precipitated capital outflows from those economies, weakening their currencies. In order to shore up their currencies, those countries have had to engage in “quantitative tightening,” i.e., selling their dollar-denominated assets (for example, U.S. government bonds) to purchase (and strengthen) their own currencies. This suggests that even without the Fed raising rates, financial conditions have been getting tighter—which likely has played a role in the recent selloff in global equities.
From a technical perspective, global equity markets have triggered several negative momentum indicators—falling below various moving averages and exhibiting negative returns over different intermediate-term time periods. Small cap stocks have underperformed large caps in recent months, implying that the current market environment is one of general risk-aversion. In fact, the continued outperformance of the S&P 500 (relative to small caps and global equity markets) belies the recent performance of a majority of the stocks in the market. The former has been held up by a narrower and narrower subset of large cap technology stocks such as Facebook, Google, and Amazon, while many sectors, particularly energy, materials, biotechs, and industrials, have experienced large drawdowns. The number of stocks below their 50-day moving averages is near an extreme. While such extremes tend to lead to higher prices in the short-to-medium term, the negative technical landscape coupled with worsening fundamentals (both macroeconomic and corporate) may not bode well should the Federal Reserve not engage in further balance sheet expansion (yet were the Fed to engage in additional QE without having tightened first, that could seriously call into question the Fed’s credibility).
Turning to equity fundamentals, earnings estimates for the S&P 500 have systematically been coming down for the past two years. At the beginning of 2014, expectations for 2015 S&P 500 operating earnings per share stood at nearly $150. Today, with 2015 almost in the books, those expectations stand at roughly $110. Expected forward earnings growth hovers near 0. In light of the fact that much of the equity market appreciation over the past several years was predicated on a high level of earnings and earnings growth, and expectations for both of these have now been tempered, it would not be unreasonable for markets to reprice commensurately lower.
Further, based on many metrics—whether one is looking at Cyclically-Adjusted Price-to-Earnings (CAPE) or Market-Cap-to-GDP or Price-to-Sales equity markets are anywhere from substantially overvalued to extremely overvalued and thus poised to deliver subnormal nominal returns (ranging from small negative to small positive, i.e., -3% to +5% annualized) over the next 7 to 10 years.
According to the research of John Hussman, the combination of negative momentum, poor market internals, and overvaluation is precisely the type of environment that has led to sharp and substantial equity drawdowns in the past, irrespective of whether the Federal Reserve was tightening or easing.
What does all of this mean for asset allocation? Our suite of equity and bond indicators (which aggregates momentum, valuation, sentiment, breadth, economic, and investor’s positioning signals) is currently suggesting a lower allocation to equities and larger allocation to bonds. While we expect equities to have modest positive returns in the future, the current environment strongly suggests caution in the near term.
This commentary should not be regarded as a complete analysis of the subjects discussed. All expressions of opinion reflect the judgment of the authors on the date of publication and may change in response to market conditions. You should consult with a professional advisor before implementing any strategies discussed. Content should not be viewed as personalized investment advice. Information presented is not an offer to buy or sell, or a solicitation of any offer to buy or sell any of the securities discussed. References to specific investments should not be construed as being past specific recommendations of the AUA Capital Management, LLC. The returns discussed in this commentary do not represent the performance of the firm or any of its advisory clients.
Past performance may not be indicative of future results. All investment strategies have the potential for profit or loss. Different types of investments involve higher and lower levels of risk. There is no guarantee that a specific investment or strategy will be suitable or profitable for an investor’s portfolio. Asset allocation and diversification will not necessarily improve an investor’s returns and cannot eliminate the risk of investment losses. Historical performance returns for investment indexes and/or categories, usually do not deduct transaction and/or custodial charges or an advisory fee, which would decrease historical performance results. There are no guarantees that a portfolio will match or outperform a specific benchmark.
AUA Capital Management, LLC, is registered as an investment adviser with the SEC. The firm only conducts business in states where it is properly registered or is excluded from registration requirements. Registration is not an endorsement of the firm by securities regulators and does not mean the adviser has achieved a specific level of skill or ability.