
On the surface, the third quarter (Q3) of 2016 seemed to be a strong one for global equity markets. Global equities rose sharply, volatility was muted, and central banks were, as usual, supportive. Looking under the surface, however, a potentially different picture emerges.
The strong equity returns were largely an unwinding of the post-Brexit selloff that occurred at the end of the second quarter. Earnings and the economy were lackluster. Equity valuations, by some measures, reached their highest levels ever—indicating that one should expect low-single-digit annualized returns over the longer term. While U.S. interest rates rose slightly on speculation that the Federal Reserve might raise rates sooner rather than later, both the Fed and the European Central Bank (ECB) floated trial balloons in the media about the possibility of buying equities (a la the Bank of Japan) should either seek to expand its quantitative easing program (QE)—which is not exactly a rousing endorsement of the current state of the economic “recovery.”
ASSET CLASS RECAP
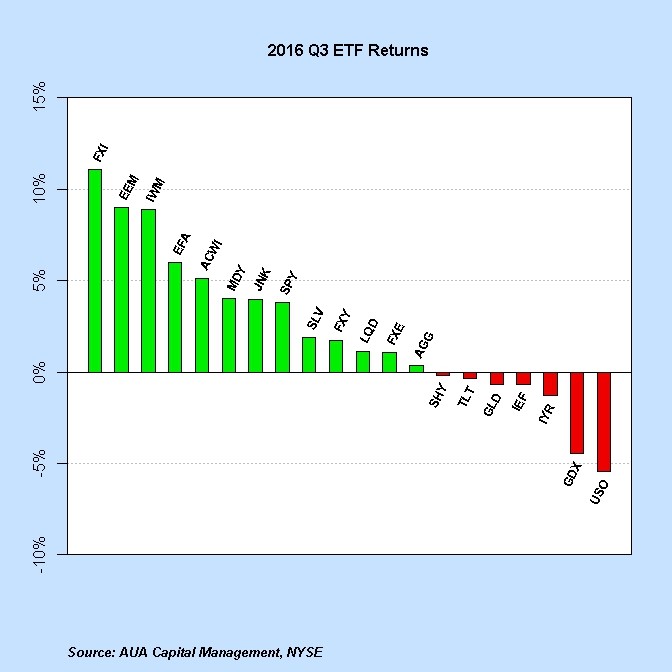
Equities: Non-U.S. equities were very strong in Q3, led by China and emerging markets (EEM). U.S. small caps (IWM) were also strong, as were large-cap technology stocks. Gold miners were weak on the back of lower gold prices, but have still led the way in 2016 with a 93% year-to-date return at the end of Q3. Despite the strong quarterly returns, equities have generally gone sideways since the end of 2014, with two large selloffs in between. Large-caps and mid-caps have appreciated at a 5% annualized rate, while small caps have risen at a 3.7% annualized rate, including dividends. Given the low-single-digit estimated returns over the next decade based on current valuations, sideways action and volatility is to be expected.
Bonds: U.S. interest rates rose slightly in Q3, seemingly on the expectation that the Federal Reserve would potentially raise interest rates in the near-term (although market-based probabilities have this as an unlikely event). Thus, perhaps part of the rate increase could also be attributed to mean-reversion after the significant fall in bond yields on account of the Brexit vote as the second quarter came to a close.
Commodities: Both oil and gold were down slightly in Q3 despite the dollar being weaker against major currencies (other than the British pound). After a hot start to the year, gold bumped up against the downtrend line from its 2011 peak and retreated.
Currencies: The dollar weakened slightly against the euro and yen in Q3. The British pound never recovered its post-Brexit loss and is down nearly 20%, as of this writing, from its pre-Brexit level (which subsequently may be boon for British exports).
CENTRAL BANK ACTIONS
In ancient Greek literature, the deus ex machina (literally “god from the machine”) was a plot device whereby the hero is saved from a hopeless situation through the intervention of a powerful and sometime magical third party that often literally swoops in to save the day. Contemporary examples include the magic sword delivered to Harry Potter by the Phoenix that saves him and the series from a certain and ignoble end, or the tyrannosaurus rex that charges in to kill the velociraptors that have the humans surrounded in Jurassic Park.
In recent years, global central banks have taken on the role of the deus ex machina, swooping in to save the day with actions or dovish jawboning anytime the markets appear to be faltering. Ben Hunt of Salient Partners calls this the Narrative of Central Bank Omnipotence, with everyone adhering to the Common Knowledge Game. Which is to say, everyone knows that everyone knows that central banks will support the market. Hence, despite significant overvaluation in U.S. equities or the lowest interest rates for centuries, central banks will have our backs. Thus, no need for worry, or so the thinking goes.
To that end, central banks maintained the illusion of control in Q3. The Federal Reserve did not raise interest rates at its September meeting, although some commentators had speculated that September would have been the ideal time for the Fed to raise rates. However, three members dissented from the decision, which may have been a foreshadowing of a rate increase at the December meeting.
We continue to think the Federal Reserve is stuck between a rock and hard place when it comes to interest rates. If it raise rates into a fragile economic recovery and a highly levered financial system, the likely result is market turmoil (see Q1 2016 after their December 2015 rate hike)—something the Fed desperately seek to avoid. If it does not raise rates, the Fed runs the risk of eventually bankrupting insurance companies and pension funds who will not be able to meet long-term obligations with the current expected return profiles of the equity and bond markets. The Fed also stands to lose credibility if it is unable to raise rates more than one time before the next recession arrives—leaving it with fewer easing options once the economy and markets begin to deteriorate again.
Across the pond, the ECB kept monetary policy unchanged in September after hinting in August at possibly expanding its QE because of the potential economic fallout from the Brexit vote. The Bank of Japan (BOJ), on the other hand, did expand its program to purchase equity ETFs that track the Topix at its September meeting, which led to a short-term pop in Japanese equities.
All of this deus ex machina-ness on the part of central banks is not free of externalities, however. In his October 3rd missive, John Hussman, economist and manager of the Hussman family of value-oriented funds, had this to say about the Federal Reserve’s actions over the past seven years:
“The great victory of the Federal Reserve in the half-cycle since 2009 was not ending the global financial crisis; the crisis actually ended in March 2009 with the stroke of a pen that changed accounting rule FAS157 and eliminated mark-to-market accounting for banks (instantly removing the specter of widespread insolvencies by allowing “significant judgment” in valuing distressed assets). The victory was not economic recovery; the trajectory of the economy since 2009 has been no different than the trajectory that could have been projected using wholly non-monetary variables. No, the great Pyrrhic victory of the Fed has been to enable the third most extreme financial bubble in history, on the basis of capitalization-weighted indices, and the single most extreme bubble in history from the standpoint of individual stocks.”
Which is to say, central bank interventions have led to distortions in asset markets that have left markets increasingly susceptible to steep losses when investors suddenly become risk-averse. At which point, central banks again step in and alleviate the near-term crisis, but further propagate the markets’ fragility by not letting asset markets find natural clearing prices of their own accord. For this reason, a buy-and-hold strategy appears to be a sub-optimal strategy for preserving wealth at this point in the cycle, as it guarantees large losses, if and when the Narrative of Central Bank Omnipotence begins to weaken.
FUNDAMENTALS, MOMENTUM & SENTIMENT
According to data from Thomson Reuters I/B/E/S, S&P 500 earnings for Q2 (reported during Q3) fell by -2.2% year-over-year (excluding the energy sector, earnings rose by 2.2%), while revenues fell by -0.5% (excluding the energy sector, revenues rose by 2.5%). According to estimates from FactSet, S&P 500 earnings for Q3 are expected to fall by 2.1%. Negative earnings growth in Q3 would market the seventh straight quarter of falling year-over-year GAAP earnings for the S&P 500. Dating back to 1936, the last time the S&P had a seven straight quarters of negative earnings growth was during the financial crisis of 2007-2009.
While profits have fallen, the S&P 500 has generally stayed afloat, trading near all-time highs (albeit with two nontrivial selloffs in between—August/September 2015, and January/February 2016). Falling earnings and rising stock prices have led to higher valuations. In fact, by some measures, such as the price-to-revenue ratio, the median stock in the S&P 500 is more overvalued now than at any other time in history. Several valuation measures that historically have had high correlations with future equity returns are currently predicting low-single-digit annualized returns for the S&P 500 over the coming decade. Given that bond yields are near all-time lows as well, a 60/40 equities/bond portfolio is thus expected to have, at best, low-single-digit returns.
As for the U.S. economy, year-over-year growth for several indicators, such as real GDP, durable goods orders, and industrial production (among others), are at levels that have historically coincided with the onset of recessions. The Atlanta Fed’s estimate for Q3 real GDP has been inauspiciously trending downward from a high of 3.7% in early August to just over 2.0% at the beginning of October.
In contrast to fundamentals, global equity momentum at the end of Q3 was relatively strong across the board. After lagging for quarters, non-U.S. equities finally joined the momentum party. This catch-up, so to speak, is not surprising given the better valuations in non-U.S. equities, which will likely lead to better long-term returns (over the coming decade) relative to U.S. equities.
While momentum was strong for global equities, sentiment in the form of how large investors were positioned—what we call the “smart money”—was not bullish for equities at the end of Q3, with three of our four smart-money indicators wanting to be out of equities. Since the year 2000, when three of our four smart-money indicators have been out of equities, equities have averaged a meager 0.70% annualized return (the blue line in the chart below). In contrast, when at least three of our four smart-money indicators have been long equities, the S&P 500 has advanced at a 19% annualized rate (the green line in the chart below). (The red line corresponds to the case when no more than one smart-money indicator wants to be long equities, that is, at least three, if not all four, of the indicators are out of equities.)
This prospective 0.70% annualized return given the current state of the “smart-money” positioning, while only forecasted to last as long as the “smart money” dislikes equities, jibes with the low single-digit expected returns (projected to last at least a decade) noted above that can be estimated independently from earnings growth and valuation levels.
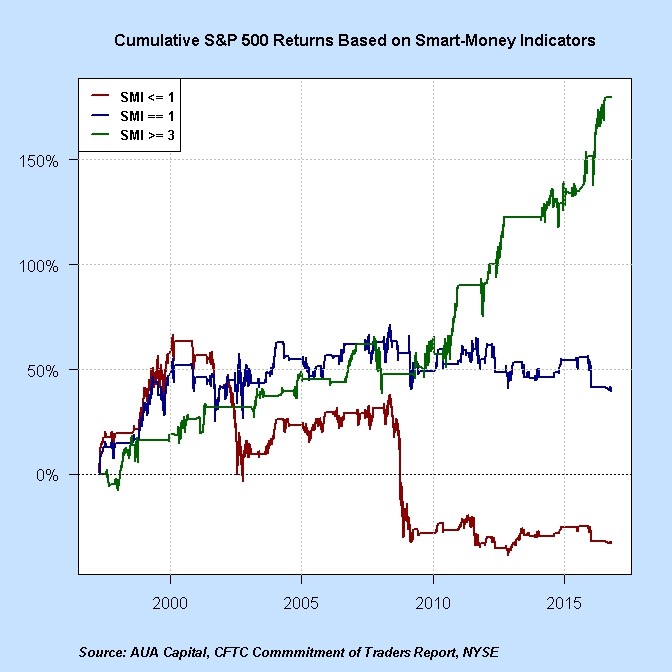
**Smart-Money Indicators do not represent the performance of AUA Capital or any of its advisory clients.
As it’s unlikely that the market will smoothly glide higher at such a low annualized rate, we expect the future to be marked by significant volatility—steep selloffs followed by strong rallies, with the market ultimately going approximately sideways once dividends are taken into account.
GLOBAL ALLOCATION
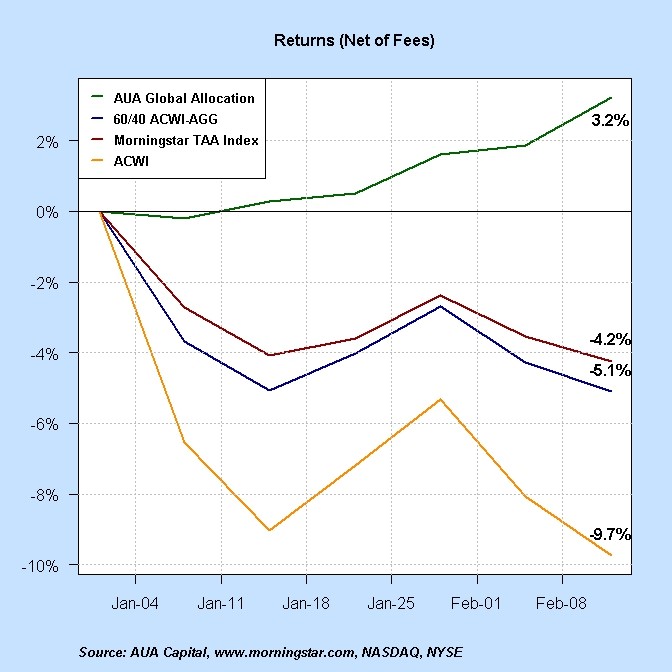
Global Allocation, our flagship tactical asset allocation strategy, continued its steady performance in Q3, rising 2.7% (net of fees), bringing its year-to-date total to 8% (net of fees). It has outpaced both the Morningstar Tactical Allocation Index (5.9%) and a 60/40 portfolio (6.1%)—consisting of ACWI, the MSCI All-Country World Index, and AGG, the iShares Barclays Aggregate U.S. Bond Fund—by approximately 200 bps each. The outperformance has largely been driven by the fact that Global Allocation avoided the severe equity market drawdown in the first quarter of this year, as the performance chart below (from January and February 2016) shows.
OUTLOOK
We are cautious with respect to our outlook for global asset markets. Economic data are lackluster. U.S. equities are by some measures the most expensive they have ever been (meaning any burst higher in U.S. equities likely will not be sustainable). Long-term expected returns are by all accounts in the low-single digits, suggesting that volatility will be a fixture of asset markets for years to come. One wonders whether the deus ex machina in the form of global central banks can continue to save the day. Areas that may hold up on a relative basis include the energy, materials, and financial sectors given their long-term underperformance relative to the broad market, as well as non-U.S. equities, which are more reasonably valued.
As always, when making allocation decisions, we will continue to be guided by our suite of broad market indicators and our dynamic risk-management approach that underlie our Global Allocation strategy.
–AUA Capital Management
AUA Capital Management is registered as an investment adviser with the SEC. The firm only conducts business in states where it is properly registered or is excluded from registration requirements. Registration is not an endorsement of the firm by securities regulators and does not mean the adviser has achieved a specific level of skill or ability.
All expressions of opinion reflect the judgment of the authors on the date of publication and may change in response to market conditions. You should consult with a professional advisor before implementing any strategies discussed. Content should not be viewed as an offer to buy or sell any of the securities mentioned or as personalized investment advice.
Different types of investments involve higher and lower levels of risk. There is no guarantee that a specific investment or strategy will be suitable or profitable for an investor’s portfolio. Asset allocation and diversification will not necessarily improve an investor’s returns and cannot eliminate the risk of investment losses.
Historical performance returns for investment indexes and/or categories, usually do not deduct transaction and/or custodial charges or an advisory fee, which would decrease historical performance results. There are no assurances that a portfolio will match or exceed any particular benchmark.