Post-Election Market Reaction

In the wake of the 2016 presidential election, global financial markets have experienced surprising and outsized moves. U.S. equity markets and the U.S. dollar have soared (especially from the overnight low on the night of the election), international equities have largely been flat, emerging-market equities are down solidly, and global bonds had their worst month in over 25 years (since the inception of the Barclays Global Aggregate Total Return Index in 1990, which tracks global bond returns).

Global bonds peaked after the Brexit vote and have been trending downward since. The question now is whether bond prices will continue to fall or whether there will be some stabilization.

With regards to the economy, the rise in interest rates may be self-limiting. That is, the higher interest rates go, the more likely it is that those higher rates slow our highly-leveraged, debt-laden economy. A slower economy would then likely lead to lower interest rates. For example, we are already seeing mortgage applications decrease as mortgage rates move higher. This jibes with what Ben Bernanke said to a coterie of hedge fund managers at a private dinner shortly after his term at the Fed had ended, namely, that interest rates would not normalize in his lifetime.

Similarly, a stronger U.S. dollar would likely not be good for emerging-market economies and their equity markets, as we have already seen with the latter since the election (EEM, the iShares MSCI Emerging Markets ETF is down 6%). This is because many of those countries have borrowed in U.S. dollars and now the loans they have to repay are more onerous. We saw similar behavior of emerging-market stocks this past January and February after the Fed first raised rates in December 2015. Prolonged stress in emerging-market equities (e.g., China) would likely have a contagion effect to global equities in general.

Earnings for S&P 500 companies would also likely take a hit due to a stronger dollar as their overseas non-U.S.-dollar earnings are converted to U.S. dollars—not to mention the potential reduction in demand for goods and services that are now more expensive in overseas’ currencies. Falling earnings at significantly high valuations would likely lead to an increasingly worse risk-return proposition in equities, which could then lead to a flight to safety in bonds (particularly if any equity selloff is accompanied by talk of further quantitative easing).

On the political front, market participants’ reaction post-election was driven by the vision that fiscal stimulus in the form of infrastructure spending coupled with major tax cuts would unleash growth and inflation. While that may be the case, it’s far from certain that either will happen or come in at the magnitude that investors are currently expecting. Indeed, both Senate Majority Leader Mitch McConnell and House Speaker Paul Ryan came out recently as being somewhat cool to the idea of tax cuts if they are not revenue-neutral.

Congressional opposition to tax cuts is logical given the $21 trillion in federal government debt that must be serviced and with no end in sight to the deficit spending. If the bond market makes servicing and rolling over that government spending much costlier, either more debt will have to be taken on or spending on other discretionary items will have be cut (not always a popular activity for politicians, especially when Americans have become accustomed to $1 worth of government spending for 80 cents in taxes). If expectations are reduced for fiscal stimulus and/or tax cuts, interest rates might stabilize and possibly revert to lower levels.

While economic and political speculation is natural, what do the data tell us?

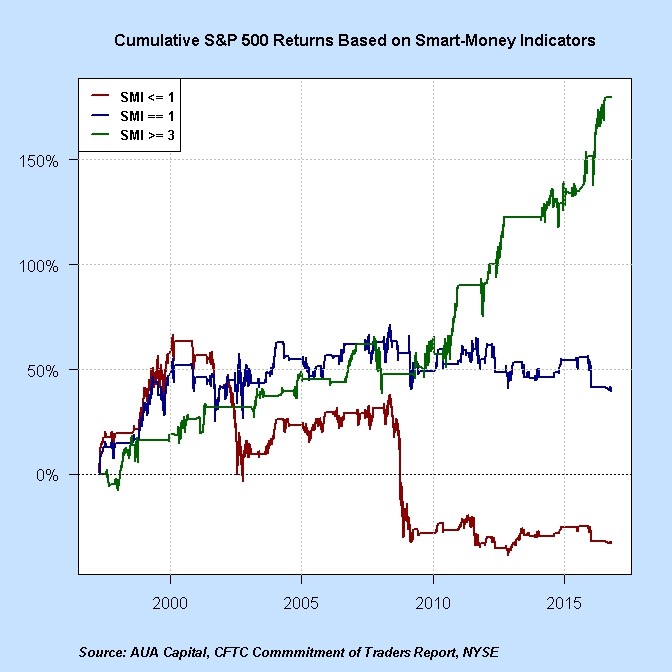
One set of indicators we track with respect to both the equity and bond markets is what we call the “smart-money indicators.” Every Friday the Commodity Futures Trading Commission issues its “Commitments of Traders” report, in which it summarizes the investment positions of three classes of traders in various financial instruments. These classes are the Commercials (big financial institutions or producers of commodities), the Speculators (hedge funds and similar investment firms), and the Non-Reportables (retail investors). Of these classes, the Commercials are thought of as the “Smart Money.”

With respect to the equity and bond markets, when the Smart Money is long the S&P 500 and retail investors are short, equities tend to do much better than average. When the Smart Money is short the 10-year U.S. bond while retail money is long, equities again tend to do better than average. The same is true when the Smart Money is short the 30-year U.S. bond while retail money is long. In the prior two cases, when the Smart Money is short bonds, it’s an implicit statement that they believe equities will outperform. Further, if the Smart Money has a longer position in the 10-year bond than in the 30-year bond, equities likewise tend to do better than average.

Prior to the election and throughout November and into December, all four of those conditions listed above were not in effect. That is, the Smart Money was largely out of equities across all four indicators. Historically, when the Smart Money is not long on any of those four indicators, equities have annualized a loss of 18.1%, while the 30-year bond has annualized a gain of 17.4%.

While the worst equity returns have tended to occur when all four of the smart money indicators are not long equities, the timing of the Smart Money is not always impeccable.  Notably, the Smart Money was completely out of equities for several months prior to the final top of the dotcom bubble, during which time the NASDAQ doubled in price!

At present, one of the four smart-money indicators wants to be long equities, but only by a small margin and that could easily revert. Meanwhile the Smart Money is currently significantly long the 30-year bond, meaning that the big institutions were buying those bonds as retail investors and speculators were selling in the wake of the election results. Given that markets eventually tend to move in the direction of the Smart Money, we would expect some mean-reversion in interest rates.

One further data point in agreement with the smart-money indicators that suggests that equities might be extended (and hence due for a pullback that would likely support bond prices) is that retail investors poured $98 billion into ETF funds since the election, which is 1.5x more than they had invested in the entire prior year. These fund flows tend to be very contrarian in nature, with the largest flows coming near market tops and the largest outflows coming near market bottoms.

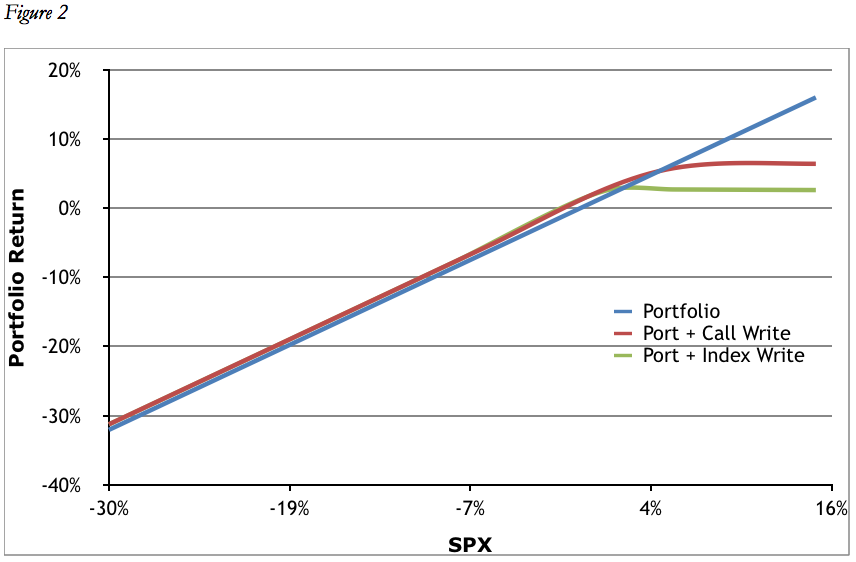
As with many things in life, longer-duration bonds present a tradeoff. Across a hundred years of market history, the longer-duration bond has been the best hedge to falling equity markets, even giving investors the potential to have positive returns when equity markets are deeply negative. On the other hand, periodically longer-duration bonds themselves undergo corrections, often when equity markets are ripping higher, which is not a pleasant experience. While the past is not necessarily prologue, investors have historically done much better in regards to long-horizon overall returns by having exposure to longer-duration bonds than they have with 10-year or even shorter-duration bonds.  It’s for this reason that we incorporate long-duration bonds into our investment strategies.

Given that extreme market moves in either direction are not sustainable at their initial blistering rate, we would expect some back-and-forth market action in both equities and bonds over the next several weeks. During this time we should get a better idea of the trajectory of the economy, of expectations for S&P 500 earnings, of the likelihood that Trump’s policy agenda will come to fruition, and of the effect that a stronger dollar is having on emerging-market economies. This incoming information should help to clarify whether equities and bonds will continue along their current paths or whether substantial reversion is in order. The data suggest reversion is in order (i.e., lower equities, higher bonds), but only time will tell.

AUA Capital Management


AUA Capital Management is registered as an investment adviser with the SEC. The firm only conducts business in states where it is properly registered or is excluded from registration requirements. Registration is not an endorsement of the firm by securities regulators and does not mean the adviser has achieved a specific level of skill or ability.

 All expressions of opinion reflect the judgment of the authors on the date of publication and may change in response to market conditions. You should consult with a professional advisor before implementing any strategies discussed. Content should not be viewed as an offer to buy or sell any of the securities mentioned or as personalized investment advice.

 Different types of investments involve higher and lower levels of risk. There is no guarantee that a specific investment or strategy will be suitable or profitable for an investor’s portfolio. Asset allocation and diversification will not necessarily improve an investor’s returns and cannot eliminate the risk of investment losses.

 Historical performance returns for investment indexes and/or categories, usually do not deduct transaction and/or custodial charges or an advisory fee, which would decrease historical performance results. There are no assurances that a portfolio will match or exceed any particular benchmark.

Sean Corcoran Joins AUA Capital Management

sean-headshot-reducedAUA Capital Management is pleased to welcome Sean Corcoran as an Institutional Sales Associate. Sean has 10 years of experience in the financial services industry including institutional sales and consultant relationship management. Prior to joining AUA, he was a business development associate with SolomonEdwards. His other previous sales and consulting roles were with M.F. Irvine Companies LLC, North American Benefits Company and The Hartford Financial Services/PLANCO. Sean is a graduate of West Chester University.

Deus ex Machina

On the surface, the third quarter (Q3) of 2016 seemed to be a strong one for global equity markets. Global equities rose sharply, volatility was muted, and central banks were, as usual, supportive. Looking under the surface, however, a potentially different picture emerges.

The strong equity returns were largely an unwinding of the post-Brexit selloff that occurred at the end of the second quarter. Earnings and the economy were lackluster. Equity valuations, by some measures, reached their highest levels ever—indicating that one should expect low-single-digit annualized returns over the longer term. While U.S. interest rates rose slightly on speculation that the Federal Reserve might raise rates sooner rather than later, both the Fed and the European Central Bank (ECB) floated trial balloons in the media about the possibility of buying equities (a la the Bank of Japan) should either seek to expand its quantitative easing program (QE)—which is not exactly a rousing endorsement of the current state of the economic “recovery.”

ASSET CLASS RECAP

Equities: Non-U.S. equities were very strong in Q3, led by China and emerging markets (EEM). U.S. small caps (IWM) were also strong, as were large-cap technology stocks. Gold miners were weak on the back of lower gold prices, but have still led the way in 2016 with a 93% year-to-date return at the end of Q3. Despite the strong quarterly returns, equities have generally gone sideways since the end of 2014, with two large selloffs in between. Large-caps and mid-caps have appreciated at a 5% annualized rate, while small caps have risen at a 3.7% annualized rate, including dividends. Given the low-single-digit estimated returns over the next decade based on current valuations, sideways action and volatility is to be expected.

Bonds: U.S. interest rates rose slightly in Q3, seemingly on the expectation that the Federal Reserve would potentially raise interest rates in the near-term (although market-based probabilities have this as an unlikely event). Thus, perhaps part of the rate increase could also be attributed to mean-reversion after the significant fall in bond yields on account of the Brexit vote as the second quarter came to a close.

Commodities: Both oil and gold were down slightly in Q3 despite the dollar being weaker against major currencies (other than the British pound). After a hot start to the year, gold bumped up against the downtrend line from its 2011 peak and retreated.

Currencies: The dollar weakened slightly against the euro and yen in Q3. The British pound never recovered its post-Brexit loss and is down nearly 20%, as of this writing, from its pre-Brexit level (which subsequently may be boon for British exports).

CENTRAL BANK ACTIONS

In ancient Greek literature, the deus ex machina (literally “god from the machine”) was a plot device whereby the hero is saved from a hopeless situation through the intervention of a powerful and sometime magical third party that often literally swoops in to save the day. Contemporary examples include the magic sword delivered to Harry Potter by the Phoenix that saves him and the series from a certain and ignoble end, or the tyrannosaurus rex that charges in to kill the velociraptors that have the humans surrounded in Jurassic Park.

fig-1


In recent years, global central banks have taken on the role of the deus ex machina, swooping in to save the day with actions or dovish jawboning anytime the markets appear to be faltering. Ben Hunt of Salient Partners calls this the Narrative of Central Bank Omnipotence, with everyone adhering to the Common Knowledge Game. Which is to say, everyone knows that everyone knows that central banks will support the market. Hence, despite significant overvaluation in U.S. equities or the lowest interest rates for centuries, central banks will have our backs. Thus, no need for worry, or so the thinking goes.

To that end, central banks maintained the illusion of control in Q3. The Federal Reserve did not raise interest rates at its September meeting, although some commentators had speculated that September would have been the ideal time for the Fed to raise rates. However, three members dissented from the decision, which may have been a foreshadowing of a rate increase at the December meeting.

We continue to think the Federal Reserve is stuck between a rock and hard place when it comes to interest rates. If it raise rates into a fragile economic recovery and a highly levered financial system, the likely result is market turmoil (see Q1 2016 after their December 2015 rate hike)—something the Fed desperately seek to avoid. If it does not raise rates, the Fed runs the risk of eventually bankrupting insurance companies and pension funds who will not be able to meet long-term obligations with the current expected return profiles of the equity and bond markets. The Fed also stands to lose credibility if it is unable to raise rates more than one time before the next recession arrives—leaving it with fewer easing options once the economy and markets begin to deteriorate again.

Across the pond, the ECB kept monetary policy unchanged in September after hinting in August at possibly expanding its QE because of the potential economic fallout from the Brexit vote. The Bank of Japan (BOJ), on the other hand, did expand its program to purchase equity ETFs that track the Topix at its September meeting, which led to a short-term pop in Japanese equities.

All of this deus ex machina-ness on the part of central banks is not free of externalities, however. In his October 3rd missive, John Hussman, economist and manager of the Hussman family of value-oriented funds, had this to say about the Federal Reserve’s actions over the past seven years:

“The great victory of the Federal Reserve in the half-cycle since 2009 was not ending the global financial crisis; the crisis actually ended in March 2009 with the stroke of a pen that changed accounting rule FAS157 and eliminated mark-to-market accounting for banks (instantly removing the specter of widespread insolvencies by allowing “significant judgment” in valuing distressed assets). The victory was not economic recovery; the trajectory of the economy since 2009 has been no different than the trajectory that could have been projected using wholly non-monetary variables. No, the great Pyrrhic victory of the Fed has been to enable the third most extreme financial bubble in history, on the basis of capitalization-weighted indices, and the single most extreme bubble in history from the standpoint of individual stocks.”

Which is to say, central bank interventions have led to distortions in asset markets that have left markets increasingly susceptible to steep losses when investors suddenly become risk-averse. At which point, central banks again step in and alleviate the near-term crisis, but further propagate the markets’ fragility by not letting asset markets find natural clearing prices of their own accord. For this reason, a buy-and-hold strategy appears to be a sub-optimal strategy for preserving wealth at this point in the cycle, as it guarantees large losses, if and when the Narrative of Central Bank Omnipotence begins to weaken.

FUNDAMENTALS, MOMENTUM & SENTIMENT

According to data from Thomson Reuters I/B/E/S, S&P 500 earnings for Q2 (reported during Q3) fell by -2.2% year-over-year (excluding the energy sector, earnings rose by 2.2%), while revenues fell by -0.5% (excluding the energy sector, revenues rose by 2.5%). According to estimates from FactSet, S&P 500 earnings for Q3 are expected to fall by 2.1%. Negative earnings growth in Q3 would market the seventh straight quarter of falling year-over-year GAAP earnings for the S&P 500. Dating back to 1936, the last time the S&P had a seven straight quarters of negative earnings growth was during the financial crisis of 2007-2009.

While profits have fallen, the S&P 500 has generally stayed afloat, trading near all-time highs (albeit with two nontrivial selloffs in between—August/September 2015, and January/February 2016). Falling earnings and rising stock prices have led to higher valuations. In fact, by some measures, such as the price-to-revenue ratio, the median stock in the S&P 500 is more overvalued now than at any other time in history. Several valuation measures that historically have had high correlations with future equity returns are currently predicting low-single-digit annualized returns for the S&P 500 over the coming decade. Given that bond yields are near all-time lows as well, a 60/40 equities/bond portfolio is thus expected to have, at best, low-single-digit returns.

As for the U.S. economy, year-over-year growth for several indicators, such as real GDP, durable goods orders, and industrial production (among others), are at levels that have historically coincided with the onset of recessions. The Atlanta Fed’s estimate for Q3 real GDP has been inauspiciously trending downward from a high of 3.7% in early August to just over 2.0% at the beginning of October.

In contrast to fundamentals, global equity momentum at the end of Q3 was relatively strong across the board.  After lagging for quarters, non-U.S. equities finally joined the momentum party. This catch-up, so to speak, is not surprising given the better valuations in non-U.S. equities, which will likely lead to better long-term returns (over the coming decade) relative to U.S. equities.

While momentum was strong for global equities, sentiment in the form of how large investors were positioned—what we call the “smart money”—was not bullish for equities at the end of Q3, with three of our four smart-money indicators wanting to be out of equities. Since the year 2000, when three of our four smart-money indicators have been out of equities, equities have averaged a meager 0.70% annualized return (the blue line in the chart below). In contrast, when at least three of our four smart-money indicators have been long equities, the S&P 500 has advanced at a 19% annualized rate (the green line in the chart below). (The red line corresponds to the case when no more than one smart-money indicator wants to be long equities, that is, at least three, if not all four, of the indicators are out of equities.)

This prospective 0.70% annualized return given the current state of the “smart-money” positioning, while only forecasted to last as long as the “smart money” dislikes equities,  jibes with the low single-digit expected returns (projected to last at least a decade) noted above that can be estimated independently from earnings growth and valuation levels.

fig-2

**Smart-Money Indicators do not represent the performance of AUA Capital or any of its advisory clients.

As it’s unlikely that the market will smoothly glide higher at such a low annualized rate, we expect the future to be marked by significant volatility—steep selloffs followed by strong rallies, with the market ultimately going approximately sideways once dividends are taken into account.

GLOBAL ALLOCATION

Global Allocation, our flagship tactical asset allocation strategy, continued its steady performance in Q3, rising 2.7% (net of fees), bringing its year-to-date total to 8% (net of fees). It has outpaced both the Morningstar Tactical Allocation Index (5.9%) and a 60/40 portfolio (6.1%)—consisting of ACWI, the MSCI All-Country World Index, and AGG, the iShares Barclays Aggregate U.S. Bond Fund—by approximately 200 bps each. The outperformance has largely been driven by the fact that Global Allocation avoided the severe equity market drawdown in the first quarter of this year, as the performance chart below (from January and February 2016) shows.

fig-3

 OUTLOOK

We are cautious with respect to our outlook for global asset markets. Economic data are lackluster. U.S. equities are by some measures the most expensive they have ever been (meaning any burst higher in U.S. equities likely will not be sustainable). Long-term expected returns are by all accounts in the low-single digits, suggesting that volatility will be a fixture of asset markets for years to come. One wonders whether the deus ex machina in the form of global central banks can continue to save the day. Areas that may hold up on a relative basis include the energy, materials, and financial sectors given their long-term underperformance relative to the broad market, as well as non-U.S. equities, which are more reasonably valued.

As always, when making allocation decisions, we will continue to be guided by our suite of broad market indicators and our dynamic risk-management approach that underlie our Global Allocation strategy.

–AUA Capital Management 


AUA Capital Management is registered as an investment adviser with the SEC. The firm only conducts business in states where it is properly registered or is excluded from registration requirements. Registration is not an endorsement of the firm by securities regulators and does not mean the adviser has achieved a specific level of skill or ability.

All expressions of opinion reflect the judgment of the authors on the date of publication and may change in response to market conditions. You should consult with a professional advisor before implementing any strategies discussed. Content should not be viewed as an offer to buy or sell any of the securities mentioned or as personalized investment advice.

Different types of investments involve higher and lower levels of risk. There is no guarantee that a specific investment or strategy will be suitable or profitable for an investor’s portfolio. Asset allocation and diversification will not necessarily improve an investor’s returns and cannot eliminate the risk of investment losses.

Historical performance returns for investment indexes and/or categories, usually do not deduct transaction and/or custodial charges or an advisory fee, which would decrease historical performance results. There are no assurances that a portfolio will match or exceed any particular benchmark.


2Q16: A Quarter in Motion

The second quarter of 2016 was a notable one in many respects for financial markets. The rally in U.S. equities continued, as did the rally in U.S. bonds, leaving stocks on the pinnacle of all-time highs and U.S. long-term interest rates on the precipice of all-time lows. Over $10 trillion in worldwide debt now has negative yields. Central banks stepped up their asset purchases in the second quarter to a level not seen since 2013. But perhaps most notably, the U.K. voted to leave the European Union (“Brexit”), an event that ushered in a short-term bout of market panic that quickly reversed itself on the back of central bank liquidity. Let’s review.

ASSET CLASS RECAP

Equities: Global equities in dollar terms were mixed in Q2. While large-, mid-, and small-cap stocks in the U.S., were up 2.5%, 4.0%, and 4.0%, respectively, developed-market equities (EFA) were down 2.3% (in dollar terms) and emerging-market equities were flat. Despite the positive performance in the U.S., it wasn’t a particularly smooth ride, especially after the Brexit vote in the U.K. (the aftermath of which hinted at the potential ferocity of any future selloff should risk-aversion return). Moreover, low volatility stocks continued to outperform high beta stocks during the quarter, suggesting some caution on the part of investors.

Defensive sectors (Staples, Healthcare, and Utilities) and Energy were the leading sectors in the S&P 500 for the quarter, while Consumer Discretionary, Tech, and Biotech (high beta) lagged. As in Q1, gold mining stocks continued their torrid pace for the year, up 39% in Q2 and up over 100% year-to-date (YTD).

Bonds: Interest rates continued to fall worldwide in Q2. The amount of global debt with negative yield surpassed $10 trillion in May. The 10-year U.S. Treasury bond yield reached a record low level, below the previous record set during the Great Depression (not something one would expect with stocks at all-time highs). Meanwhile, the U.S. yield curve continued to flatten, an indication in years past of slowing growth. U.S. corporate bonds and high-yield bonds had strong quarters, as well, up 4% and 6%, respectively. But the best performing fixed income instrument was the U.S. long bond, which returned nearly 7%. Whether the performance of the long bond was due to a general lack of supply of positive-yield debt or an indication that economic growth continues to slow, remains an open question.

 Commodities: While the plunge in oil and its effect on equities was the big story in Q1, oil headlines were not as prominent in Q2. Crude oil, however, was up 20% during the quarter, which helped alleviate fears of Energy sector bankruptcies and high yield bond defaults. Precious metals also saw positive returns in Q2, with gold up 7.5% and silver up 22%.

 Currencies: The U.S. dollar strengthened modestly, up 1.7% on a trade-weighted basis. The Japanese yen was up nearly 9% against the dollar (which, coupled with Ben Bernanke’s visit to Japan in early July, has prompted speculation that the Bank of Japan will embark on so-called “helicopter money”—the permanent monetization of government deficits—in order to weaken the yen). The euro weakened 2.7% against the dollar. Notably, the British pound fell 10% against the dollar after the U.K. voted to leave the E.U. which, contrary to pre-vote fear-mongering, propelled the FTSE 100 to fresh new highs for U.K. investors.

0716 Fig 1

CENTRAL BANK ACTIONS & COMMUNICATIONS

 The Federal Open Market Committee met twice during the second quarter and did not raise rates either time, using lackluster global growth, low inflation, and a slowing jobs market as reasons to forestall further rate hikes. In doing so, they emphasized their continued vigilance in monitoring the incoming economic data and then listed a broad array of indicators that they will take into account when deciding monetary policy—effectively giving themselves enormous wiggle room not to raise rates for the foreseeable future.

In light of the build-up of leverage in the financial system since the Financial Crisis, the capital flight from emerging markets when the dollar strengthens, the $2 trillion in deficit spending proposed by Congress for this fiscal year, and the continued need to roll over maturing debt, it is unlikely the Federal Reserve will ever be able to raise interest rates even moderately without sparking a major negative reaction in global markets. (Ben Bernanke, soon after he left the Fed, was quoted at a private meeting of hedge fund managers saying that rates will never “normalize” in his lifetime.) Indeed, by the end of Q2, the Fed Funds futures markets were not pricing in any additional rate hikes until October 2018.

One very notable development regarding central bank actions is that central bank liquidity (asset purchases) rose to its highest level in over three years during the second quarter, which may explain the exuberance in both equities and bonds. (Chart and analysis courtesy of Citi.)

0716 Fig 2

FUNDAMENTALS, TECHNICALS, SENTIMENT & GROWTH

 On the surface, the fundamental situation for U.S. equities at the end of Q2 was relatively unfavorable when judged by the light of history. GAAP earnings ($98.61) continued their recession in Q1 (reported in Q2), and are now down 14% from their peak in September 2014 ($114.50). That puts the S&P 500 trading at over 21x GAAP earnings (the S&P 500 peaked back in 2007 in the range of 17x-18x GAAP earnings). Further, Q2 GAAP earnings (to be reported in Q3) are estimated to have declined 5% year-over-year. As mentioned previously, the median stock in the S&P 500 was the most expensive it has ever been on a price-to-sales basis, while Shiller’s cyclically-adjusted price-to-earnings (CAPE) ratio is at the 94th percentile of its 130-year data history.

In light of these valuations, many prominent asset managers are forecasting 10-year forward annualized returns for the S&P 500 in the low single digits, if not negative. These forecasts are based on the relatively constant level of historical earnings growth and a presumed reversion to the mean for valuation multiples. Our own proprietary measures are suggesting 10-year annualized (nominal) returns in the 4%-5% range—certainly below historical levels, but not as dire as some forecasts.

Whether stocks return 0% annualized or 5% annualized over the next 10 years, however, neither result precludes the market from experiencing a significant drawdown at any point in time should a serious and sustained bout of risk-aversion arise (as Q1 demonstrated).

From a technical perspective, momentum at the end of Q2 was mixed, while some markets were at or near all-time high, others were still down significantly from their peaks in 2015, though most short-term momentum indicators were relatively positive. As for sentiment, the “smart-money” institutional traders were relatively neutral with respect to their positioning in the S&P 500.

On the growth front, the Atlanta Fed GDPNow Tracker is forecasting Q2 GDP to come in between 2% – 2.5%, after Q1’s growth of 0.4%. Despite that respectable growth forecast, Deutsche Bank recently reported that they are forecasting a 60% chance of a U.S. recession within 12 months based on the continued flattening of the yield curve. Critics were quick to argue, however, that the reduced supply of government bonds because of central bank buying has reduced the effectiveness of the yield curve as a leading indicator of growth. We should have an answer one way or the other by the end of the year.

GLOBAL ALLOCATION & CORE EQUITY

AUA’s proprietary strategies, Global Allocation and Core Equity, had mixed performances in Q2. Global Allocation, a systematic, tactical asset allocation strategy that aggregates market information across multiple factors and frequencies, returned 1.45% (net of fees), bringing its return for the year to 5% (with no substantive drawdown, having been out of equities during the Q1 swoon). Its 60/40 ACWI/AGG benchmark returned 1.75% for the quarter and is up 4.5% for the year, while the Morningstar Tactical Allocation Index was up 2.28% for the quarter and is up 3.23% for the year.

In contrast, Core Equity, a tax-efficient, concentrated single-stock portfolio of liquid large-, mid-, and small-cap stocks that are selected based on their aggregate attractiveness across factors that have historically provided excess returns (momentum, valuation, low volatility, profitability, mean-reversion), finished the quarter down 6% (net of fees), underperforming both the Russell 3000 (+2.6%) and the Russell 1000 (+2.5%). This contrasts to Core Equity’s positive outperformance in the first quarter of 1.4% and 1.1%, respectively.

As of mid-year, Core Equity is down 4%, while the Russell 3000 is up 3.6% and the Russell 1000 is up 3.7%. The underperformance of Core Equity was largely driven by poor earnings performances of the stocks held by the strategy. While this underperformance has already begun to abate in early Q3, its manifestation in Q2 demonstrates that the rise in the equity markets was not universally shared by all stocks. Indeed, this mixed breadth, coupled with the underperformance of high beta stocks, may be a tell-tale indication that the current market rally is relatively narrow and perhaps limited. Over the medium-term, we expect some type of reversion between the stocks in the Core Equity portfolio and the Russell 1000 and 3000.

 OUTLOOK

While many of the issues we highlighted in Q1 remain extant at the end of Q2—namely, deteriorating earnings and profit margins, historically high equity valuations, lingering negative momentum in some global equity markets, muted economic growth—and some newer developments have arisen (Brexit, low-volatility stocks continuing to outperform high-beta stocks, ongoing  flattening of the yield curve, etc.), our signals have us neutrally-weighted in global equities and overweight long-term U.S. government bonds going into Q3.

As Q3 progresses, we should get more information regarding the nature of the yield-curve flattening (is it primarily because of slowing growth or central bank purchases?), the sustainability of the equity rally (is it poised to move sustainably higher or is it narrowing and on its last legs?), and the expectations for Q3 earnings and economic growth.

Whatever transpires, however, we will continue to be guided, in a disciplined fashion, by our data-driven and time-tested market indicators; indicators that have, heretofore, helped us to avoid large drawdowns, while also enabling us to take tactical risk exposure when prudent.


AUA Capital Management is registered as an investment adviser with the SEC. The firm only conducts business in states where it is properly registered or is excluded from registration requirements. Registration is not an endorsement of the firm by securities regulators and does not mean the adviser has achieved a specific level of skill or ability.

All expressions of opinion reflect the judgment of the authors on the date of publication and may change in response to market conditions. You should consult with a professional advisor before implementing any strategies discussed. Content should not be viewed as an offer to buy or sell any of the securities mentioned or as personalized investment advice.

Different types of investments involve higher and lower levels of risk. There is no guarantee that a specific investment or strategy will be suitable or profitable for an investor’s portfolio. Asset allocation and diversification will not necessarily improve an investor’s returns and cannot eliminate the risk of investment losses.

Historical performance returns for investment indexes and/or categories, usually do not deduct transaction and/or custodial charges or an advisory fee, which would decrease historical performance results. There are no assurances that a portfolio will match or exceed any particular benchmark.

Michelle Malloy, Esquire, Joins AUA Capital Management

AUmalloy20r1A Capital Management is pleased to welcome Michelle Malloy, Esquire as General Counsel and Director of Family Office Services in its West Conshohocken office.  Michelle has 18 years’ experience working with and representing high net worth clients and entrepreneurs in all facets of their estate and business planning.  Prior to joining AUA, Michelle was a Director in the Wilmington Family Office and a VP and Senior Fiduciary Advisor with the Wilmington Trust Company in Wilmington, Delaware.  She has also worked in private practice in the Philadelphia area.  She received her Juris Doctorate and Masters of Legal Letters (Taxation) from Villanova University School of Law, and is admitted to the Pennsylvania and New York bars and the United States Tax Court.

March 2016 Commentary

The first quarter of 2016 turned out to be a capricious and turbulent one for financial markets. The quarter was punctuated by significant equity market drawdowns and rallies, oil prices in the mid-20s and low-40s, central bank actions and about-faces, and the resurgence of precious metals and miners, to name but a few developments. Just as March is said to come in like a lion and out like a lamb, the same could be said of Q1 2016—although the prevailing calm at quarter’s end, may yet again prove to be merely temporary.

Asset Class Recap

Equities: Fortunes looked bleak for global equity markets by the second week of February, getting off to their worst start for a year in the modern era. Maximum equity market drawdowns ranged from -10% to -20% globally. Then, as quickly as they fell, equities rebounded, finishing the quarter roughly flat as measured by the MSCI All Country World Index (ACWI +0.4%). The S&P 500 was marginally positive (SPY +1.3%), while the Russell 2000, which by mid-quarter had entered bear market territory from its 2015 peak, finished marginally negative (IWM -1.4%). Emerging markets had a strong quarter (EEM +6.4%) despite China finishing down (FXI -4.3%). Gold mining stocks were the big winners, however, finishing the quarter up 45%.

Bonds: U.S. government bonds, particularly at the long end, were the beneficiaries of the equity market volatility, providing a safe haven for investors, despite a relatively hawkish policy stance from the Federal Reserve coming into the quarter. However, some might say “because of a relatively hawkish policy stance,” as the prospect of the Federal Reserve tightening into a slowdown in global growth had investors fearing a recession. Yields on the 10-year and 30-year U.S. government bonds fell significantly during the quarter as investors recalibrated their views on global economic growth. Investment grade bonds also performed solidly (LQD +4.8%). High yield bonds (JNK +2.0%) finished the quarter moderately positive despite reaching an interim bottom mid-quarter some 25% below their July 2014 peak level. The increase in high yield bond spreads was partly driven by the fear of energy companies defaulting. This fear was lessened as oil prices rebounded sharply from their mid-February low.

Commodities: Oil prices were a prime driver of broad market movements and sentiment in Q1. Oil prices and equity markets bottomed in tandem on February 11th. Oil prices subsequently rebounded nearly 50% over the balance of the quarter after pronouncements by OPEC and non-OPEC countries of a potential production freeze. The other notable development in the commodity space was the resurgence of gold and silver, both of which had been in multi-year bear markets (having peaked in 2011). Gold finished the quarter up 15%, while silver finished the quarter up 11%.

Currencies: Despite a hawkish policy stance from the Federal Reserve coming into the quarter, and stronger relative growth in the U.S. than abroad, the U.S. dollar fell during the quarter, as markets anticipated that the Federal Reserve would have to change its hawkish policy stance. Several rate hikes for 2016 had been priced into the Fed funds futures in December 2015, but by mid-quarter, the next rate hike was not expected until the end of 2017. Commensurately, the euro and Japanese yen both had strong quarters, up 4.5% and 6.6%, respectively.

Chart 1

Figure 1: Q1 2016 returns for select asset class ETFs

Chart 2

Figure 2: Q1 2016 maximum peak-to-trough drawdowns for select asset class ETFs

Central Bank Actions & Communications

The large rebound in global equities and commodities from their lows in mid-February can largely be attributed to monetary policy machinations by central banks. On January 29th, as risk assets tumbled, the Bank of Japan surprised markets by instituting a negative interest rate policy (NIRP). The initial reaction was one of euphoria, with the yen weakening and global equity markets rallying. But that effect was reversed in short-order as stocks once again turned down in early February and the yen began a strong march higher (finishing the quarter up 7.5% from the close on the day that NIRP was announced). Next up was the European Central Bank (ECB). On March 10th, the ECB cut rates to 0 and boosted quantitative easing. While European stocks benefited slightly from that move, the euro (as with the yen after NIRP) became much stronger (contrary to the ECB’s intentions). Finally, stepping to the plate on March 16th, the Federal Reserve lowered its forecasts for the trajectory of interest rates, taking a more dovish stance. This change in stance was likely spurred by the substantial selloff in global equity markets in the early part of the quarter. The currency markets had anticipated this policy change as the dollar weakened and the euro and yen strengthened throughout the quarter.

Fundamentals, Technicals, Sentiment, & Growth

From a fundamental perspective, global earnings for Q1 are expected to continue the global earnings recession. According to Factset, S&P 500 earnings are forecast to decline 9.1% year-over-year. If that is indeed the case, it will be the first time since Q4 2008 through Q3 2009 that the S&P has experienced four straight quarters of year-over-year earnings declines. S&P 500 earnings have declined over 15% from their peak in Q3 2014, yet the market, as of this writing, is only a few percent below its all-time highs, putting the cyclically-adjusted price-to-earnings ratio (CAPE) at the 93rd percentile historically. Continued buoyancy in stocks may be difficult to sustain should earnings continue to decline.

On the momentum front, despite the strong rally from the lows, medium-term global equity momentum is still fairly negative across the board, with many developed and emerging markets still deep in bear market territory. Further, the S&P 500 has gone more than 11 months without a new 52-week high. Historically, this lack of a new 52-week high has been indicative of the presence of a nascent cyclical bear market during “secular bear markets” (i.e., 15-20 year periods where the market is flat relative to inflation, such as the period we have experienced since the peak of the dotcom bubble in 2000 and which we may still be mired in). During secular bull markets, a lack of a new 52-week high was not an impediment to further equity gains.

As for sentiment, starting in late January, the commercial traders (i.e., the so-called “smart money”) as designated by the Commitment of Traders report had significant net long positioning in equities (relative to their historical average positioning) and the non-reportable traders (i.e., the so-called “dumb money”) had significant net short positioning in equities (relative to their historical average).  Notably, the same was true at the interim bottom in September 2015. During the subsequent rally from mid-February to the end of Q1, the smart-money began to sell into the rally up to the point that now the situation has been reversed: the “smart money” has a net short positioning in equities relative to their historical average position, while the “dumb money” is net long. Such positioning may present a headwind to further substantive equity gains.

With respect to U.S. economic growth, in early February, Q1 GDP was originally forecast by the Atlanta Fed’s GDPNow tracker to be 2.7%. But as of the end of Q1 that forecast had been revised down to 0.4%, which jibes with the generally lackluster economic and trade data emanating from the rest of the world.

Global Allocation & Core Equity

AUA’s proprietary strategies, Global Allocation and Core Equity, both performed solidly in Q1. Global Allocation, a systematic, tactical asset allocation strategy that aggregates market information across multiple factors and frequencies, returned 3.25% while completely avoiding the significant drawdown experienced by the equity markets, as Global Allocation was mainly allocated to long duration U.S. bonds and had virtually no allocation to global equities. Heading into Q2, the equity allocation has increased to approximately 20% of the portfolio, but it still remains significantly underweight equities due to the continued presence of substantial negative equity momentum across global equity markets.

Core Equity, a tax-efficient, concentrated single-stock portfolio of liquid large-, mid-, and small-cap stocks that are selected based on their aggregate attractiveness across factors that have historically provided excess returns (momentum, valuation, low volatility, profitability, mean-reversion), finished the quarter up 2.05%, outperforming the Russell 3000 by 1.15% and the Russell 1000 by .85%.

In light of the confluence of deteriorating global earnings and profit margins, high equity valuations, continued negative momentum across global equity markets, stagnant economic growth, and smart-money selling into the late-quarter rally, we believe it’s prudent to be underweight equities and overweight long-duration U.S. government bonds, which have benefited and will likely continue to benefit from renewed equity market volatility.


 AUA Capital Management is registered as an investment adviser with the SEC. The firm only conducts business in states where it is properly registered or is excluded from registration requirements. Registration is not an endorsement of the firm by securities regulators and does not mean the adviser has achieved a specific level of skill or ability.

 All expressions of opinion reflect the judgment of the authors on the date of publication and may change in response to market conditions. You should consult with a professional advisor before implementing any strategies discussed. Content should not be viewed as an offer to buy or sell any of the securities mentioned or as personalized investment advice. References to ETFs are intended to show the returns of an index and should not be construed as the performance of AUA Capital Management. Historical performance returns for investment indexes and/or categories, usually do not deduct transaction and/or custodial charges or an advisory fee, which would decrease historical performance results. There are no assurances that a portfolio will match or exceed any particular benchmark.


 Different types of investments involve higher and lower levels of risk. There is no guarantee that a specific investment or strategy will be suitable or profitable for an investor’s portfolio. Asset allocation and diversification will not necessarily improve an investor’s returns and cannot eliminate the risk of investment losses.

PLODDING ALONG : What Does Economic Data Reveal About the U.S. Economy and What Is the Impact On the Equity Markets?

Last month, we noted that the markets were off to a rocky start in 2016.  We observed that yields on long duration U.S. government bonds fell sharply, as markets began pricing in a possible U.S. recession and a deeper slowdown in global growth.  This theme continued throughout February; returns on the Standard & Poor’s 500 (“SPX”) and iShares Russell 200 Index (“IWM”) were essentially flat in the month — down 41 basis points (“bps”) and 22 bps, respectively — while iShares Barclays 20+ Year Treasury Bond EFT (“TLT”) increased 300 bps.  The iShares MSCI EAFE Index Fund (“EFA”) declined 330 bps despite negative interest rate policy by Japan and quantitative easing in Europe.

But economic data released recently suggests that fears of a recession in the U.S. could be overblown.  4Q15 Gross Domestic Product (“GDP”) was revised upward to 1% growth – not robust, but not a contraction either.  Oil has stabilized in the low to mid $30s per barrel.  The labor market remains tight.  Higher housing prices are boosting wealth.  These two factors combined suggest that fundamentals for consumer spending remain very strong.  In fact, personal income spending increased 0.5% in January.  Consumer spending comprises two-thirds of the U.S. economy.

On the manufacturing side (12% of the U.S. economy), activity in February shrank less than forecast and contracted at a slower pace than in January.  This could indicate that the manufacturing industry could soon stabilize.  The Institute for Supply Management (“ISM”) manufacturing index registered 49.5, slightly below 50, which is the dividing line between contraction and expansion.  The January reading equaled 48.2.  Half of the industries included in the index expanded for the first time since August; makers of wood products, textiles, furniture, and chemicals were particularly strong.  Domestic demand boosted by consumers could have contributed to strength in these areas.  Both capital equipment orders and factory output increased in January.    Either the headwinds (soft global demand, strong U.S. dollar, inventory overhang, and weakness in the capital-intensive oil industry) that the manufacturing sector faced in late 2014 and in 2015 are receding or the U.S. consumer continues to propel the U.S. economy forward.

In addition, construction spending surged 1.5% in January, reaching the highest level since 2007.  Private residential construction increased 0.5%.  Private non-residential construction increased 1%.  Public construction spending rose 4.5%.  It is possible, though, that mild winter weather could have pushed demand forward.

In short, upbeat data from consumer spending, labor market, industrial production, durable goods and construction spending indicate the U.S. economy may be regaining momentum at this time.

But what does this mean for equity markets and allocation between stocks and bonds?  Earnings have contracted three quarters in a row, pointing to a recession.  However, earnings are a lagging indicator of economic strength.  If economic growth in 2016 remains anemic and if the Federal Reserve continues on a cautious, measured path of rate hikes, then equity markets have no compelling reason to rally and could remain in a trading range.  In the short term, equity markets may continue to have lackluster performances.

While the data may be pointing towards a stabilizing economy, the growth rate it is still nothing to write home about. Looking beyond the S&P 500, virtually all global markets and the US small caps are in a bear market. Meanwhile, the year over year rate of change in NFP (non farm payrolls) is decreasing and that likely means this economic cycle has peaked.  In a world of negative interest rate policies and deflation, the probabilities seem to be against a sustained rally in equities or a spike in interest rates. In the short term, we suspect there will be a fair amount of volatility in both directions.

Based on an investor’s time horizon and risk tolerance, we continue to maintain a cautious posture with an underweight in global equities in our strategic allocation portfolios.  We believe there is little to justify a sustained robust movement upward in equities and if an investor currently has a full or overweight position we recommend using rallies as potential re-balancing opportunities.


AUA Capital Management is registered as an investment adviser with the SEC. The firm only conducts business in states where it is properly registered or is excluded from registration requirements. Registration is not an endorsement of the firm by securities regulators and does not mean the adviser has achieved a specific level of skill or ability.

All expressions of opinion reflect the judgment of the authors on the date of publication and may change in response to market conditions. You should consult with a professional advisor before implementing any strategies discussed. Content should not be viewed as an offer to buy or sell any of the securities mentioned or as personalized investment advice. References to ETFs are intended to show the returns of an index and should not be construed as the performance of AUA Capital Management. Historical performance returns for investment indexes and/or categories, usually do not deduct transaction and/or custodial charges or an advisory fee, which would decrease historical performance results. There are no assurances that a portfolio will match or exceed any particular benchmark.

Different types of investments involve higher and lower levels of risk. There is no guarantee that a specific investment or strategy will be suitable or profitable for an investor’s portfolio. Asset allocation and diversification will not necessarily improve an investor’s returns and cannot eliminate the risk of investment losses.

The Global Market Landscape in Early 2016

Global equity markets got off to a rocky start in 2016, while yields on long duration U.S. government bonds fell sharply, as markets began pricing in a possible U.S. recession and a deeper slowdown in global growth. Our Global Allocation strategy was well-positioned for this turbulence, having been significantly underweight equities and overweight bonds since the beginning of August 2015.

The S&P 500 started the year off with a 9% drawdown before rallying in the last few trading days of the month to finish January down only 5% after Japan’s central bank instituted a negative interest rate policy (NIRP). Developed markets (EFA) finished the month down 6% (after having been down 11%), while emerging markets (EEM) finished the month down 5.5% (after having been down 13%).

The bounce in the equity markets coincided with a bounce in the price of crude oil, which rebounded from a 13-year low of $26 to finish the month near $33 a barrel. Small-cap stocks suffered even deeper losses as IWM was down as much as 13% before finishing the month down 9%. China, perhaps the epicenter of the slowdown in global growth as its credit bubble bursts, finished down 13% after having been down 17% mid-month.

Notably, the mega-cap FANG stocks (Facebook +7% in January, but -10% prior to its earnings announcement; Amazon, -15% in January; Netflix,-20%; and Google, -3%), which had held the S&P 500 afloat in 2015, masking broad-based weakness throughout the market, finally showed signs of vulnerability.

Long-duration U.S. bonds (TLT) rose 5.4% in January as the 30-year yield fell from 3% to 2.75%. 10-year yields fell from 2.26% to 1.93%. Emerging market bonds finished flat on the month after being down 2% prior to NIRP.

Gold and mining stocks while up only modestly in January, at 5% and 3%, respectively, have started off February at a torrid pace. Gold was up 10% through February 5th, while mining stocks were up 22%, in what may be the first signs of investors beginning to question the credibility and “omnipotence” of central bankers. Significantly, the NIRP equity bounce has all but evaporated as of this writing. In December, the raising of interest rates by the Federal Reserve along with the S&P 500 just shy of its all-time high was widely acclaimed by the financial press as evidence of a U.S. recovery and that the Fed could justifiably say “mission accomplished.” Now the consensus has shifted to viewing the rate hike as a policy error, with the market now not pricing in another rate hike until November 2017 at the earliest (when multiple rate hikes for 2016 had been priced in just a month ago).

With 63% of the companies in the S&P 500 having reported earnings as of February 5th, the year-over-year earnings decline for the index is 3.8%. Q4 2015 marks the first time since Q1-Q3 2009 that the S&P 500 has seen three consecutive quarters of year-over-year earnings declines.

The profits recession coupled with the ongoing manufacturing recession, equity market selloff, ongoing hard landing in China, and flattening of the U.S. yield curve has brought to the forefront the possibility that the U.S. may be headed for, if not already in, a recession. Various studies have been trotted out on both sides of the argument to bolster or refute the notion. Q4 2015 GDP appears to be tracking in the 0.0% to 0.4% range, while Q1 2016 GDP is currently forecasted at 2.4%

Other macro developments include a continued loss in foreign reserves for China as it sells dollars to defend the yuan from speculators who envision China having to devalue its currency to help stabilize the fallout from the bursting of its credit bubble. And in both the U.S. and Europe, financial stocks are suffering deep losses as poor earnings combine with fears of a global growth slowdown and the effects of NIRP to scare away investors.

In light of the turmoil across the global financial landscape, we are suggesting that clients use the inevitable short-term rallies in equities to continue to reduce overall global equity exposure and increase long-duration U.S. government bond exposure. With earnings decreasing, U.S. equities are still significantly overvalued relative to history despite the recent selloff. Further, the slowdown in global growth and the exceedingly low (or negative) bond yields across developed markets should bolster the attractiveness of long-duration U.S. government bonds.

Our positioning in our Global Allocation strategy remains significantly defensive. We continue to have a substantial underweight to global equities and a substantial overweight to long-duration U.S. bonds. This positioning has only intensified (less equities, more bonds/cash) in recent months as equity market momentum turned negative and we anticipate it will remain that way until equity market momentum stabilizes or turns positive.


This commentary should not be regarded as a complete analysis of the subjects discussed. All expressions of opinion reflect the judgment of the authors on the date of publication and may change in response to market conditions. You should consult with a professional advisor before implementing any strategies discussed. Content should not be viewed as personalized investment advice. Information presented is not an offer to buy or sell, or a solicitation of any offer to buy or sell any of the securities discussed. References to specific investments should not be construed as being past specific recommendations of the AUA Capital Management, LLC. The returns discussed in this commentary do not represent the performance of the firm or any of its advisory clients.

Past performance may not be indicative of future results. All investment strategies have the potential for profit or loss. Different types of investments involve higher and lower levels of risk. There is no guarantee that a specific investment or strategy will be suitable or profitable for an investor’s portfolio. Asset allocation and diversification will not necessarily improve an investor’s returns and cannot eliminate the risk of investment losses. Historical performance returns for investment indexes and/or categories, usually do not deduct transaction and/or custodial charges or an advisory fee, which would decrease historical performance results. There are no guarantees that a portfolio will match or outperform a specific benchmark.

AUA Capital Management, LLC, is registered as an investment adviser with the SEC. The firm only conducts business in states where it is properly registered or is excluded from registration requirements. Registration is not an endorsement of the firm by securities regulators and does not mean the adviser has achieved a specific level of skill or ability.

Third Quarter 2015 Insights

At end of the third quarter, the S&P 500 had its first negative total return quarter since the third quarter of 2012. In addition to having its first negative quarter in three years, S&P 500 returns have now turned negative when measured from the end of QE3 (“quantitative easing” round 3), which concluded in October 2014—giving credence to the argument that in order for equity returns to remain positive the Federal Reserve must perpetually expand its balance sheet (recall that equity returns faltered after QE1, which led to QE2, and after QE2, which led to QE3…)

Chart 9-29

While the Fed itself continues to communicate its intention to raise rates in 2015, the recent pullback in equities has led to murmurs from some market participants that the Fed should do more quantitative easing. Indeed, Fed funds futures rates indicate that investors are not expecting a rate increase until March 2016 (whereas they had seen two rate increases in 2015 earlier this year). Those economists who see recession on the horizon claim the Fed may have already missed its window to tighten, making this the first economic cycle where the Fed did not tighten even once between recessions.

So where do things stand? On the macroeconomic front there are several interdependent developments to take note of, all driven primarily by what’s happening in China. As China’s growth has slowed and fears of a hard landing have surfaced, estimates for global growth have come down. Commodity prices have commensurately tumbled, leaving many commodity-exporting emerging market countries in dire straits financially, which has precipitated capital outflows from those economies, weakening their currencies. In order to shore up their currencies, those countries have had to engage in “quantitative tightening,” i.e., selling their dollar-denominated assets (for example, U.S. government bonds) to purchase (and strengthen) their own currencies. This suggests that even without the Fed raising rates, financial conditions have been getting tighter—which likely has played a role in the recent selloff in global equities.

From a technical perspective, global equity markets have triggered several negative momentum indicators—falling below various moving averages and exhibiting negative returns over different intermediate-term time periods. Small cap stocks have underperformed large caps in recent months, implying that the current market environment is one of general risk-aversion. In fact, the continued outperformance of the S&P 500 (relative to small caps and global equity markets) belies the recent performance of a majority of the stocks in the market. The former has been held up by a narrower and narrower subset of large cap technology stocks such as Facebook, Google, and Amazon, while many sectors, particularly energy, materials, biotechs, and industrials, have experienced large drawdowns. The number of stocks below their 50-day moving averages is near an extreme. While such extremes tend to lead to higher prices in the short-to-medium term, the negative technical landscape coupled with worsening fundamentals (both macroeconomic and corporate) may not bode well should the Federal Reserve not engage in further balance sheet expansion (yet were the Fed to engage in additional QE without having tightened first, that could seriously call into question the Fed’s credibility).

Turning to equity fundamentals, earnings estimates for the S&P 500 have systematically been coming down for the past two years. At the beginning of 2014, expectations for 2015 S&P 500 operating earnings per share stood at nearly $150. Today, with 2015 almost in the books, those expectations stand at roughly $110. Expected forward earnings growth hovers near 0. In light of the fact that much of the equity market appreciation over the past several years was predicated on a high level of earnings and earnings growth, and expectations for both of these have now been tempered, it would not be unreasonable for markets to reprice commensurately lower.

Further, based on many metrics—whether one is looking at Cyclically-Adjusted Price-to-Earnings (CAPE) or Market-Cap-to-GDP or Price-to-Sales equity markets are anywhere from substantially overvalued to extremely overvalued and thus poised to deliver subnormal nominal returns (ranging from small negative to small positive, i.e., -3% to +5% annualized) over the next 7 to 10 years.
According to the research of John Hussman, the combination of negative momentum, poor market internals, and overvaluation is precisely the type of environment that has led to sharp and substantial equity drawdowns in the past, irrespective of whether the Federal Reserve was tightening or easing.

What does all of this mean for asset allocation? Our suite of equity and bond indicators (which aggregates momentum, valuation, sentiment, breadth, economic, and investor’s positioning signals) is currently suggesting a lower allocation to equities and larger allocation to bonds. While we expect equities to have modest positive returns in the future, the current environment strongly suggests caution in the near term.

This commentary should not be regarded as a complete analysis of the subjects discussed. All expressions of opinion reflect the judgment of the authors on the date of publication and may change in response to market conditions. You should consult with a professional advisor before implementing any strategies discussed. Content should not be viewed as personalized investment advice. Information presented is not an offer to buy or sell, or a solicitation of any offer to buy or sell any of the securities discussed. References to specific investments should not be construed as being past specific recommendations of the AUA Capital Management, LLC. The returns discussed in this commentary do not represent the performance of the firm or any of its advisory clients.

Past performance may not be indicative of future results. All investment strategies have the potential for profit or loss. Different types of investments involve higher and lower levels of risk. There is no guarantee that a specific investment or strategy will be suitable or profitable for an investor’s portfolio. Asset allocation and diversification will not necessarily improve an investor’s returns and cannot eliminate the risk of investment losses. Historical performance returns for investment indexes and/or categories, usually do not deduct transaction and/or custodial charges or an advisory fee, which would decrease historical performance results. There are no guarantees that a portfolio will match or outperform a specific benchmark.

AUA Capital Management, LLC, is registered as an investment adviser with the SEC. The firm only conducts business in states where it is properly registered or is excluded from registration requirements. Registration is not an endorsement of the firm by securities regulators and does not mean the adviser has achieved a specific level of skill or ability.

Enhancing Equity Portfolios through Option Overlays

Arnold DiLaura, Managing Director

April 2015

Writing covered calls on equity positions in a portfolio is a useful way of generating additional income as the call writer is monetizing a portion of the stock’s potential upside over the option’s 30- or 60-day lifetime.

The risk of covered calls is that at expiry the stock will be higher than the strike price and either the stock will be called away, the short call will have to be bought back, or the option position will be “rolled”– the short call will be bought back and the purchase will be financed by selling a longer-dated, higher-strike price call. Rolling in effect gives the stock further room to appreciate. If a stock is called away, another potential strategy is the use of a cash-secured put which we discuss in more detail below.

When looking at a portfolio, there are two ways to write calls: 1) The first is on a portion of some or all of the individual stocks in the underlying portfolio, 2) The second is to write index call options on the portfolio as a whole. Each technique has its own advantages and disadvantages.

Writing calls on the individual stocks will generate more income, all else being equal. This is because the implied volatility of options on individual stocks is almost always higher than the implied volatility on an index which includes the underlying stocks. All else being equal, the higher the implied volatility, the higher the option premium. Figure 1 below shows a comparison of the annualized stand-still returns at various call-away probabilities for an ETF which trades at a 20% implied volatility versus a 38% implied volatility.

Figure 1

Even though writing calls on the index generates less income, it has certain advantages: 1) The first is simplicity, in that the call writer is writing options on one index, not 30 or 40 stocks, 2) The other advantage is that the individual stocks are free to appreciate unencumbered. If one of the stocks in the portfolio is the subject of a takeover and doubles overnight, the stockholder gets the full gain.  If options had been written on the stock, the stockholder would only get the gains up to the strike price.

Figure 2 shows a graphic comparison between writing calls on individual stocks in an illustrative large-cap portfolio, and writing an index call on the same portfolio. In this example, the portfolio is equal capital weighted. In selecting options for individual stocks, one can first calculate the probability that any particular strike price will be in- or out-of-the-money at expiry. One can then look for those options that have a 25% probability or less of being in-the-money (ITM), and that still generate a sufficient annualized return. The specific stocks, option strike prices, premiums, percentages out-of-the-money (OTM), and stand-still returns are shown in Table 1.  Writing a call on each stock will generate about 80 b.p. in premium (relative to the total value of the equity portfolio) over the 60 day period, or an approximate 4.8% annualized return. Table 1 shows that the option strike prices vary from about 3.5% to over 9% OTM. This means that the stocks can appreciate from 3.5% to 9% over a 60 day period without the risk of being called away.

For comparison purposes we selected and sized an index option on the portfolio as a whole which would generate the same amount of option premium, 80 b.p.  As Figure 2 shows, the index strike price is much closer to at-the-money (ATM) than any of the single stocks – about 2%.  This means that the risk of underperformance in a rising market is significantly higher with the index option methodology than the single stock option methodology – 2% vs. 5%.

Figure 2

                                   Table 1

Ticker Last Strike %OTM Stand-still Return (Annualized)
EMC 26.28 28 6.54% 3.31%
SNY 52.56 55 4.64% 5.99%
CAH 66.2 70 5.74% 3.85%
AAPL 604.71 640 5.84% 6.00%
NOV 82.07 85 3.57% 6.18%
ORCL 41.56 45 8.28% 3.46%
MSFT 39.68 42 5.85% 3.63%
USB 41.11 43 4.60% 3.28%
ECL 106.67 110 3.12% 5.20%
TMO 114.47 120 4.83% 8.12%
XLK 36.71 39 6.24% 0.74%
TWX 68.8925 75 8.87% 3.00%
JCI 46.68 50 7.11% 5.14%
COP 77.85 80 2.76% 6.20%
CELG 147.65 160 8.36% 8.07%
MON 115.9 120 3.54% 9.01%
GOOGL 540.39 560 3.63% 12.60%
PFE 29.25 31 5.98% 5.33%
STJ 64.13 70 9.15% 6.08%
SPY 187.55 195 3.97% 1.23%
WFC 48.96 52.5 7.23% 1.84%
QCOM 79.86 85 6.44% 1.62%
BA 129.58 135 4.18% 6.76%
JNJ 100.25 105 4.74% 1.83%
PEP 85.65 90 5.08% 2.38%
XOM 100.67 105 4.30% 3.40%
WAG 68.88 75 8.89% 6.45%
BBT 37.09 39 5.15% 4.37%
UTX 113.1 120 6.10% 2.31%
DIS 81.09 85 4.82% 6.33%
PG 80.23 85 5.95% 1.12%
EWBC 32.95 35 6.22% 9.10%

What about Puts?

Until now we have been talking about using covered calls to generate income on an equity portfolio. Put options, which convey the right to sell a particular stock at a particular price at some point in the future can also be used as part of an options overlay strategy.

One way they can be used is for protection: one can use a portion of the cash premium generated by selling covered calls on individual stocks to purchase broad-based ETF or Index puts (or put-spreads) thus providing a degree of downside protection for the portfolio as a whole.

The second use of puts in an overlay strategy consists of selling cash-secured, out-of-the-money (OTM) puts as a way of potentially acquiring a stock cheaper than its current price. For example, let’s say we like XYZ stock at its current price of $50, but we would like it even more if we could get it for $45. We could sell a 60-day, $45 strike put for $1. If the stock declined to $45 or below at expiry, we would then be obliged to buy the stock at $45. But we would have still taken in the original $1 credit, which is a stand-still annualized return of 13%.

This strategy can also be used for stocks which have been called away. For example, if one wrote an 80 strike call on a stock that had been trading in the 70s but which subsequently shot up over 80, that stock would be called away. However, after the stock was called away one would have $80 in cash, and assuming one still liked the stock, they could write an 80, or even 75, strike put, taking in an additional cash premium while waiting for the stock to decline to where they would buy it again.

Overlay Timing

When are the best times to implement options overlays?

  1. Anytime an investor or portfolio manager needs to generate more cash than will be provided by the regular interest and dividends from portfolio assets. Selling covered calls can avoid the need to liquidate assets to cover disbursements.
  2. When equity valuations are stretched and consequently huge gains going forward are less likely. In this environment, where long term equity returns are projected to be in the low single digits, a covered call program could double or triple those returns.


AUA Capital Management, LLC does not render legal, accounting, or tax advice. This analysis has been prepared solely for informational purposes and is not a solicitation or an offer to buy any security or instrument or to participate in any trading strategy. Any performance data quoted represents past performance. Investment return and principal value of an investment will fluctuate so that an investor’s shares, when redeemed, may be worth more or less than their original cost. Past performance is no guarantee of future results. This data is gathered from what is believed to be reliable sources, but we cannot guarantee its accuracy.

AUA Capital Management, LLC blog, white papers and website are made available for information and educational purposes only. The blog, white papers and website give general information and do not provide investment advice. By reading our blog, white papers and website, you understand that there is no advisor-client relationship created between you and AUA Capital Management, LLC. Although the information on our blog, white papers and website is intended to be current and accurate, the information presented may not reflect the most current developments, regulatory actions or investment decisions. These materials may be changed, improved, or updated without notice. AUA Capital Management, LLC is not responsible for any errors or omissions in the content of the blog, white papers or website or for damages arising from the use or performance of the blog, white papers and website under any circumstances. We encourage you to contact us or other investment advisors for specific investment advice as to your particular matter.

You may print a copy of any part of this blog or white paper for your own personal, noncommercial use, but you may not copy any part of the blog or white paper for any other purposes, and you may not modify any part of the blog or white paper. Inclusion of any part of the content of this blog, white paper or website in another work, whether in printed or electronic, or other form, or inclusion of any part hereof in another web site by linking, framing, or otherwise without the express permission of AUA Capital Management, LLC is prohibited.