
The second quarter of 2016 was a notable one in many respects for financial markets. The rally in U.S. equities continued, as did the rally in U.S. bonds, leaving stocks on the pinnacle of all-time highs and U.S. long-term interest rates on the precipice of all-time lows. Over $10 trillion in worldwide debt now has negative yields. Central banks stepped up their asset purchases in the second quarter to a level not seen since 2013. But perhaps most notably, the U.K. voted to leave the European Union (“Brexit”), an event that ushered in a short-term bout of market panic that quickly reversed itself on the back of central bank liquidity. Let’s review.
ASSET CLASS RECAP
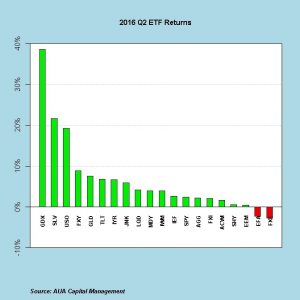
Equities: Global equities in dollar terms were mixed in Q2. While large-, mid-, and small-cap stocks in the U.S., were up 2.5%, 4.0%, and 4.0%, respectively, developed-market equities (EFA) were down 2.3% (in dollar terms) and emerging-market equities were flat. Despite the positive performance in the U.S., it wasn’t a particularly smooth ride, especially after the Brexit vote in the U.K. (the aftermath of which hinted at the potential ferocity of any future selloff should risk-aversion return). Moreover, low volatility stocks continued to outperform high beta stocks during the quarter, suggesting some caution on the part of investors.
Defensive sectors (Staples, Healthcare, and Utilities) and Energy were the leading sectors in the S&P 500 for the quarter, while Consumer Discretionary, Tech, and Biotech (high beta) lagged. As in Q1, gold mining stocks continued their torrid pace for the year, up 39% in Q2 and up over 100% year-to-date (YTD).
Bonds: Interest rates continued to fall worldwide in Q2. The amount of global debt with negative yield surpassed $10 trillion in May. The 10-year U.S. Treasury bond yield reached a record low level, below the previous record set during the Great Depression (not something one would expect with stocks at all-time highs). Meanwhile, the U.S. yield curve continued to flatten, an indication in years past of slowing growth. U.S. corporate bonds and high-yield bonds had strong quarters, as well, up 4% and 6%, respectively. But the best performing fixed income instrument was the U.S. long bond, which returned nearly 7%. Whether the performance of the long bond was due to a general lack of supply of positive-yield debt or an indication that economic growth continues to slow, remains an open question.
Commodities: While the plunge in oil and its effect on equities was the big story in Q1, oil headlines were not as prominent in Q2. Crude oil, however, was up 20% during the quarter, which helped alleviate fears of Energy sector bankruptcies and high yield bond defaults. Precious metals also saw positive returns in Q2, with gold up 7.5% and silver up 22%.
Currencies: The U.S. dollar strengthened modestly, up 1.7% on a trade-weighted basis. The Japanese yen was up nearly 9% against the dollar (which, coupled with Ben Bernanke’s visit to Japan in early July, has prompted speculation that the Bank of Japan will embark on so-called “helicopter money”—the permanent monetization of government deficits—in order to weaken the yen). The euro weakened 2.7% against the dollar. Notably, the British pound fell 10% against the dollar after the U.K. voted to leave the E.U. which, contrary to pre-vote fear-mongering, propelled the FTSE 100 to fresh new highs for U.K. investors.
CENTRAL BANK ACTIONS & COMMUNICATIONS
The Federal Open Market Committee met twice during the second quarter and did not raise rates either time, using lackluster global growth, low inflation, and a slowing jobs market as reasons to forestall further rate hikes. In doing so, they emphasized their continued vigilance in monitoring the incoming economic data and then listed a broad array of indicators that they will take into account when deciding monetary policy—effectively giving themselves enormous wiggle room not to raise rates for the foreseeable future.
In light of the build-up of leverage in the financial system since the Financial Crisis, the capital flight from emerging markets when the dollar strengthens, the $2 trillion in deficit spending proposed by Congress for this fiscal year, and the continued need to roll over maturing debt, it is unlikely the Federal Reserve will ever be able to raise interest rates even moderately without sparking a major negative reaction in global markets. (Ben Bernanke, soon after he left the Fed, was quoted at a private meeting of hedge fund managers saying that rates will never “normalize” in his lifetime.) Indeed, by the end of Q2, the Fed Funds futures markets were not pricing in any additional rate hikes until October 2018.
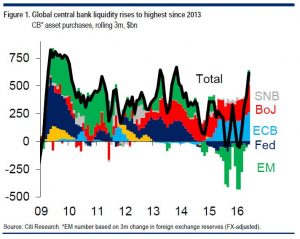
One very notable development regarding central bank actions is that central bank liquidity (asset purchases) rose to its highest level in over three years during the second quarter, which may explain the exuberance in both equities and bonds. (Chart and analysis courtesy of Citi.)
FUNDAMENTALS, TECHNICALS, SENTIMENT & GROWTH
On the surface, the fundamental situation for U.S. equities at the end of Q2 was relatively unfavorable when judged by the light of history. GAAP earnings ($98.61) continued their recession in Q1 (reported in Q2), and are now down 14% from their peak in September 2014 ($114.50). That puts the S&P 500 trading at over 21x GAAP earnings (the S&P 500 peaked back in 2007 in the range of 17x-18x GAAP earnings). Further, Q2 GAAP earnings (to be reported in Q3) are estimated to have declined 5% year-over-year. As mentioned previously, the median stock in the S&P 500 was the most expensive it has ever been on a price-to-sales basis, while Shiller’s cyclically-adjusted price-to-earnings (CAPE) ratio is at the 94th percentile of its 130-year data history.
In light of these valuations, many prominent asset managers are forecasting 10-year forward annualized returns for the S&P 500 in the low single digits, if not negative. These forecasts are based on the relatively constant level of historical earnings growth and a presumed reversion to the mean for valuation multiples. Our own proprietary measures are suggesting 10-year annualized (nominal) returns in the 4%-5% range—certainly below historical levels, but not as dire as some forecasts.
Whether stocks return 0% annualized or 5% annualized over the next 10 years, however, neither result precludes the market from experiencing a significant drawdown at any point in time should a serious and sustained bout of risk-aversion arise (as Q1 demonstrated).
From a technical perspective, momentum at the end of Q2 was mixed, while some markets were at or near all-time high, others were still down significantly from their peaks in 2015, though most short-term momentum indicators were relatively positive. As for sentiment, the “smart-money” institutional traders were relatively neutral with respect to their positioning in the S&P 500.
On the growth front, the Atlanta Fed GDPNow Tracker is forecasting Q2 GDP to come in between 2% – 2.5%, after Q1’s growth of 0.4%. Despite that respectable growth forecast, Deutsche Bank recently reported that they are forecasting a 60% chance of a U.S. recession within 12 months based on the continued flattening of the yield curve. Critics were quick to argue, however, that the reduced supply of government bonds because of central bank buying has reduced the effectiveness of the yield curve as a leading indicator of growth. We should have an answer one way or the other by the end of the year.
GLOBAL ALLOCATION & CORE EQUITY
AUA’s proprietary strategies, Global Allocation and Core Equity, had mixed performances in Q2. Global Allocation, a systematic, tactical asset allocation strategy that aggregates market information across multiple factors and frequencies, returned 1.45% (net of fees), bringing its return for the year to 5% (with no substantive drawdown, having been out of equities during the Q1 swoon). Its 60/40 ACWI/AGG benchmark returned 1.75% for the quarter and is up 4.5% for the year, while the Morningstar Tactical Allocation Index was up 2.28% for the quarter and is up 3.23% for the year.
In contrast, Core Equity, a tax-efficient, concentrated single-stock portfolio of liquid large-, mid-, and small-cap stocks that are selected based on their aggregate attractiveness across factors that have historically provided excess returns (momentum, valuation, low volatility, profitability, mean-reversion), finished the quarter down 6% (net of fees), underperforming both the Russell 3000 (+2.6%) and the Russell 1000 (+2.5%). This contrasts to Core Equity’s positive outperformance in the first quarter of 1.4% and 1.1%, respectively.
As of mid-year, Core Equity is down 4%, while the Russell 3000 is up 3.6% and the Russell 1000 is up 3.7%. The underperformance of Core Equity was largely driven by poor earnings performances of the stocks held by the strategy. While this underperformance has already begun to abate in early Q3, its manifestation in Q2 demonstrates that the rise in the equity markets was not universally shared by all stocks. Indeed, this mixed breadth, coupled with the underperformance of high beta stocks, may be a tell-tale indication that the current market rally is relatively narrow and perhaps limited. Over the medium-term, we expect some type of reversion between the stocks in the Core Equity portfolio and the Russell 1000 and 3000.
OUTLOOK
While many of the issues we highlighted in Q1 remain extant at the end of Q2—namely, deteriorating earnings and profit margins, historically high equity valuations, lingering negative momentum in some global equity markets, muted economic growth—and some newer developments have arisen (Brexit, low-volatility stocks continuing to outperform high-beta stocks, ongoing flattening of the yield curve, etc.), our signals have us neutrally-weighted in global equities and overweight long-term U.S. government bonds going into Q3.
As Q3 progresses, we should get more information regarding the nature of the yield-curve flattening (is it primarily because of slowing growth or central bank purchases?), the sustainability of the equity rally (is it poised to move sustainably higher or is it narrowing and on its last legs?), and the expectations for Q3 earnings and economic growth.
Whatever transpires, however, we will continue to be guided, in a disciplined fashion, by our data-driven and time-tested market indicators; indicators that have, heretofore, helped us to avoid large drawdowns, while also enabling us to take tactical risk exposure when prudent.
AUA Capital Management is registered as an investment adviser with the SEC. The firm only conducts business in states where it is properly registered or is excluded from registration requirements. Registration is not an endorsement of the firm by securities regulators and does not mean the adviser has achieved a specific level of skill or ability.
All expressions of opinion reflect the judgment of the authors on the date of publication and may change in response to market conditions. You should consult with a professional advisor before implementing any strategies discussed. Content should not be viewed as an offer to buy or sell any of the securities mentioned or as personalized investment advice.
Different types of investments involve higher and lower levels of risk. There is no guarantee that a specific investment or strategy will be suitable or profitable for an investor’s portfolio. Asset allocation and diversification will not necessarily improve an investor’s returns and cannot eliminate the risk of investment losses.
Historical performance returns for investment indexes and/or categories, usually do not deduct transaction and/or custodial charges or an advisory fee, which would decrease historical performance results. There are no assurances that a portfolio will match or exceed any particular benchmark.