
The first quarter of 2016 turned out to be a capricious and turbulent one for financial markets. The quarter was punctuated by significant equity market drawdowns and rallies, oil prices in the mid-20s and low-40s, central bank actions and about-faces, and the resurgence of precious metals and miners, to name but a few developments. Just as March is said to come in like a lion and out like a lamb, the same could be said of Q1 2016—although the prevailing calm at quarter’s end, may yet again prove to be merely temporary.
Asset Class Recap
Equities: Fortunes looked bleak for global equity markets by the second week of February, getting off to their worst start for a year in the modern era. Maximum equity market drawdowns ranged from -10% to -20% globally. Then, as quickly as they fell, equities rebounded, finishing the quarter roughly flat as measured by the MSCI All Country World Index (ACWI +0.4%). The S&P 500 was marginally positive (SPY +1.3%), while the Russell 2000, which by mid-quarter had entered bear market territory from its 2015 peak, finished marginally negative (IWM -1.4%). Emerging markets had a strong quarter (EEM +6.4%) despite China finishing down (FXI -4.3%). Gold mining stocks were the big winners, however, finishing the quarter up 45%.
Bonds: U.S. government bonds, particularly at the long end, were the beneficiaries of the equity market volatility, providing a safe haven for investors, despite a relatively hawkish policy stance from the Federal Reserve coming into the quarter. However, some might say “because of a relatively hawkish policy stance,” as the prospect of the Federal Reserve tightening into a slowdown in global growth had investors fearing a recession. Yields on the 10-year and 30-year U.S. government bonds fell significantly during the quarter as investors recalibrated their views on global economic growth. Investment grade bonds also performed solidly (LQD +4.8%). High yield bonds (JNK +2.0%) finished the quarter moderately positive despite reaching an interim bottom mid-quarter some 25% below their July 2014 peak level. The increase in high yield bond spreads was partly driven by the fear of energy companies defaulting. This fear was lessened as oil prices rebounded sharply from their mid-February low.
Commodities: Oil prices were a prime driver of broad market movements and sentiment in Q1. Oil prices and equity markets bottomed in tandem on February 11th. Oil prices subsequently rebounded nearly 50% over the balance of the quarter after pronouncements by OPEC and non-OPEC countries of a potential production freeze. The other notable development in the commodity space was the resurgence of gold and silver, both of which had been in multi-year bear markets (having peaked in 2011). Gold finished the quarter up 15%, while silver finished the quarter up 11%.
Currencies: Despite a hawkish policy stance from the Federal Reserve coming into the quarter, and stronger relative growth in the U.S. than abroad, the U.S. dollar fell during the quarter, as markets anticipated that the Federal Reserve would have to change its hawkish policy stance. Several rate hikes for 2016 had been priced into the Fed funds futures in December 2015, but by mid-quarter, the next rate hike was not expected until the end of 2017. Commensurately, the euro and Japanese yen both had strong quarters, up 4.5% and 6.6%, respectively.
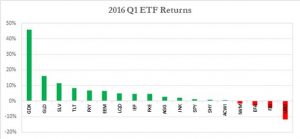
Figure 1: Q1 2016 returns for select asset class ETFs
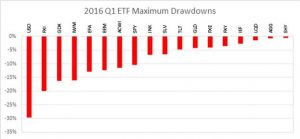
Figure 2: Q1 2016 maximum peak-to-trough drawdowns for select asset class ETFs
Central Bank Actions & Communications
The large rebound in global equities and commodities from their lows in mid-February can largely be attributed to monetary policy machinations by central banks. On January 29th, as risk assets tumbled, the Bank of Japan surprised markets by instituting a negative interest rate policy (NIRP). The initial reaction was one of euphoria, with the yen weakening and global equity markets rallying. But that effect was reversed in short-order as stocks once again turned down in early February and the yen began a strong march higher (finishing the quarter up 7.5% from the close on the day that NIRP was announced). Next up was the European Central Bank (ECB). On March 10th, the ECB cut rates to 0 and boosted quantitative easing. While European stocks benefited slightly from that move, the euro (as with the yen after NIRP) became much stronger (contrary to the ECB’s intentions). Finally, stepping to the plate on March 16th, the Federal Reserve lowered its forecasts for the trajectory of interest rates, taking a more dovish stance. This change in stance was likely spurred by the substantial selloff in global equity markets in the early part of the quarter. The currency markets had anticipated this policy change as the dollar weakened and the euro and yen strengthened throughout the quarter.
Fundamentals, Technicals, Sentiment, & Growth
From a fundamental perspective, global earnings for Q1 are expected to continue the global earnings recession. According to Factset, S&P 500 earnings are forecast to decline 9.1% year-over-year. If that is indeed the case, it will be the first time since Q4 2008 through Q3 2009 that the S&P has experienced four straight quarters of year-over-year earnings declines. S&P 500 earnings have declined over 15% from their peak in Q3 2014, yet the market, as of this writing, is only a few percent below its all-time highs, putting the cyclically-adjusted price-to-earnings ratio (CAPE) at the 93rd percentile historically. Continued buoyancy in stocks may be difficult to sustain should earnings continue to decline.
On the momentum front, despite the strong rally from the lows, medium-term global equity momentum is still fairly negative across the board, with many developed and emerging markets still deep in bear market territory. Further, the S&P 500 has gone more than 11 months without a new 52-week high. Historically, this lack of a new 52-week high has been indicative of the presence of a nascent cyclical bear market during “secular bear markets” (i.e., 15-20 year periods where the market is flat relative to inflation, such as the period we have experienced since the peak of the dotcom bubble in 2000 and which we may still be mired in). During secular bull markets, a lack of a new 52-week high was not an impediment to further equity gains.
As for sentiment, starting in late January, the commercial traders (i.e., the so-called “smart money”) as designated by the Commitment of Traders report had significant net long positioning in equities (relative to their historical average positioning) and the non-reportable traders (i.e., the so-called “dumb money”) had significant net short positioning in equities (relative to their historical average). Notably, the same was true at the interim bottom in September 2015. During the subsequent rally from mid-February to the end of Q1, the smart-money began to sell into the rally up to the point that now the situation has been reversed: the “smart money” has a net short positioning in equities relative to their historical average position, while the “dumb money” is net long. Such positioning may present a headwind to further substantive equity gains.
With respect to U.S. economic growth, in early February, Q1 GDP was originally forecast by the Atlanta Fed’s GDPNow tracker to be 2.7%. But as of the end of Q1 that forecast had been revised down to 0.4%, which jibes with the generally lackluster economic and trade data emanating from the rest of the world.
Global Allocation & Core Equity
AUA’s proprietary strategies, Global Allocation and Core Equity, both performed solidly in Q1. Global Allocation, a systematic, tactical asset allocation strategy that aggregates market information across multiple factors and frequencies, returned 3.25% while completely avoiding the significant drawdown experienced by the equity markets, as Global Allocation was mainly allocated to long duration U.S. bonds and had virtually no allocation to global equities. Heading into Q2, the equity allocation has increased to approximately 20% of the portfolio, but it still remains significantly underweight equities due to the continued presence of substantial negative equity momentum across global equity markets.
Core Equity, a tax-efficient, concentrated single-stock portfolio of liquid large-, mid-, and small-cap stocks that are selected based on their aggregate attractiveness across factors that have historically provided excess returns (momentum, valuation, low volatility, profitability, mean-reversion), finished the quarter up 2.05%, outperforming the Russell 3000 by 1.15% and the Russell 1000 by .85%.
In light of the confluence of deteriorating global earnings and profit margins, high equity valuations, continued negative momentum across global equity markets, stagnant economic growth, and smart-money selling into the late-quarter rally, we believe it’s prudent to be underweight equities and overweight long-duration U.S. government bonds, which have benefited and will likely continue to benefit from renewed equity market volatility.
AUA Capital Management is registered as an investment adviser with the SEC. The firm only conducts business in states where it is properly registered or is excluded from registration requirements. Registration is not an endorsement of the firm by securities regulators and does not mean the adviser has achieved a specific level of skill or ability.
All expressions of opinion reflect the judgment of the authors on the date of publication and may change in response to market conditions. You should consult with a professional advisor before implementing any strategies discussed. Content should not be viewed as an offer to buy or sell any of the securities mentioned or as personalized investment advice. References to ETFs are intended to show the returns of an index and should not be construed as the performance of AUA Capital Management. Historical performance returns for investment indexes and/or categories, usually do not deduct transaction and/or custodial charges or an advisory fee, which would decrease historical performance results. There are no assurances that a portfolio will match or exceed any particular benchmark.
Different types of investments involve higher and lower levels of risk. There is no guarantee that a specific investment or strategy will be suitable or profitable for an investor’s portfolio. Asset allocation and diversification will not necessarily improve an investor’s returns and cannot eliminate the risk of investment losses.